
 |
. |
| |
One of the columns in my worksheet displays
only "####." What's wrong?
How do I format the numbers so that they are shown
as currency (percentage, etc.)?
How do I center text across more than one column?
How do I enter a formula?
How do I copy a formula?
What is the difference between a relative cell
reference and an absolute cell reference?
How do I create a graph?
How do I resize my graph (picture, etc.)?
How do I format my worksheet to print on a single
page?
How can I make my sheet print with the gridlines showing?
One of the columns in my worksheet
displays only "####." What's wrong?
The width of the column is too small to show the number that should be
displayed. You will notice that if you highlight the cell, the number will
show up in the formula bar. Increase the width of the column by either
dragging the edge of the column header or by using the menu:
Format-Column-Width.

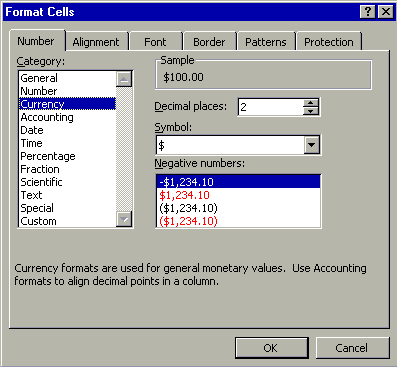
| How do I format the numbers so that
they are shown as currency (percentage, etc.)?
Highlight the cell(s) you want to format. Use the menu
Format-cells. A Dialog box (as shown at right) will open up.
From here, you can manipulate how the contents of the cell look in many
different ways, including the format, alignment, color, and font.
|
 |
How do I center text across more than one
column?
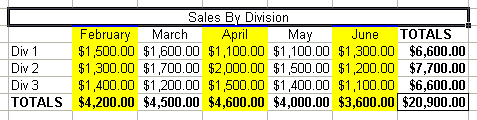
First, enter the text and highlight the columns you wish to center across as
shown below:
Then, click the  button. (If you do not see this button, use the menu View-Toolbars-Formatting
to make it appear.) The cells will merge and the text will be centered
within this new cell as shown below:
button. (If you do not see this button, use the menu View-Toolbars-Formatting
to make it appear.) The cells will merge and the text will be centered
within this new cell as shown below:
How do I enter a formula?
Excel can perform both standard calculator functions as well as advanced
algebraic, statistical, logical, and financial calculations. Every
calculated cell will begin with an equal sign (=).
To enter a simple calculation, such as multiplying one cell by another:
 | Select the cell where you want the results of the calculation to
display
| Enter an equal sign (=)
| Select the first cell you want to multiply
| Enter the multiplication sign (*)
| Select the second cell you want to multiply
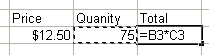
| Press Enter |
| | | | |
How do I copy a formula?
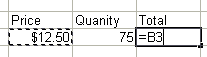
Unless you specify absolute cell references,
Excel formulae can be copied to different areas of the worksheet. For
instance, if you SUM a column of numbers and you have a different column of
numbers with the same number of cells, you can "reuse" the sum formula
by copying it to the cell that corresponds to the cell from which you are
copying. (top illustration below
To copy the formula, highlight the cell containing the formula and use the menu
Edit-Copy. Select the cell that you want to copy the formula to and use
the menu Edit-Paste. (bottom illustration below)
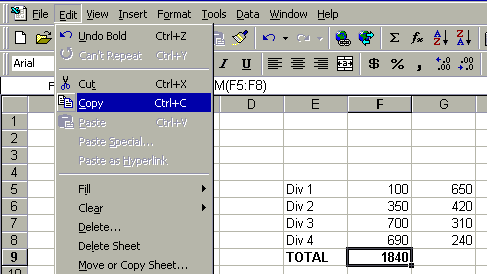
Copying A Cell |
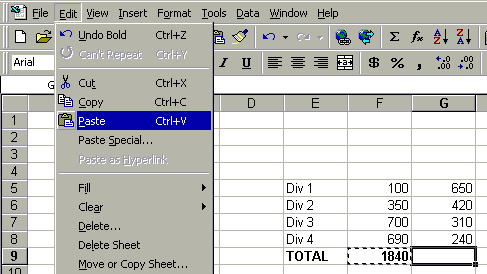 Pasting
A Cell Pasting
A Cell |
What is the difference between a relative
cell reference and an absolute cell reference?
When used in a formula, a relative cell reference denotes the cell used in
the calculation by location in relation to the cell being modified. For
example, if you have the following formula in cell C1: "=A1+B1" then
what you are telling Excel is "Add the value in the cell two cells to the
left of this cell to the value in the cell one cell to the left of this
cell." If you copied this formula to cell C2, the formula would
change to "=A2+B2"
On the other hand, an absolute reference is a cell reference that does not
change when the formula is copied. You can create an absolute reference by
placing dollar signs ($) to the left and right of the column letter in the cell
reference. For example, if you changed the formula above to read
"=$A$1+B1" and copied it to C2, the formula would become
"=$A$1+B2" (This indicates that the formula will add the value
in cell A1 to the value in cell B2.)
This concept can get a bit confusing.
How do I create a graph / chart?
Most charts can be quickly and easily created using the chart wizard.
Invoke the chart wizard by clicking on the  button in the standard toolbar.
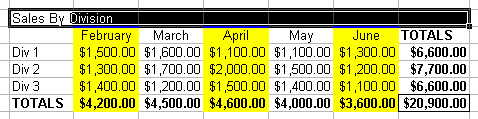
Let's take a look at an example of the chart wizard in action. Let's say
that we have 5 months worth of sales figures from three different divisions of a
company. This data has been organized into the following table: 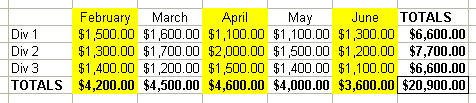 Suppose
then that we wished to create a pie chart that showed the three sales divisions'
sales over this time. Suppose
then that we wished to create a pie chart that showed the three sales divisions'
sales over this time.
First, we would invoke the chart wizard by clicking on the
button in the standard toolbar. The first step in creating any chart is to
define which type of chart you want to create. In this case, pick the pie
chart and click on the "next" button. 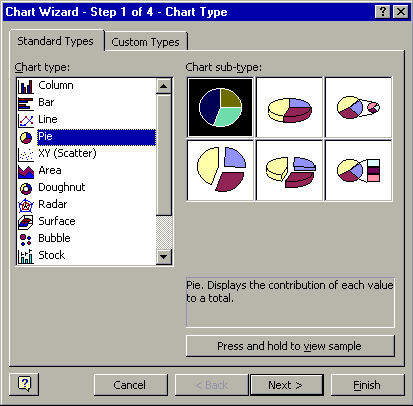 Next,
you need to select the cells that contain the basic data you need to create the
chart. The easiest way to select this data is by clicking the Data Range
Box ( Next,
you need to select the cells that contain the basic data you need to create the
chart. The easiest way to select this data is by clicking the Data Range
Box ( ). ).
When you click the ,
the Chart Wizard will minimize and you will be given the opportunity to
highlight the cells you want to use. In the graphic below, the range has
already been highlighted and you can see that it is being reflected in the Data
Range Selector:
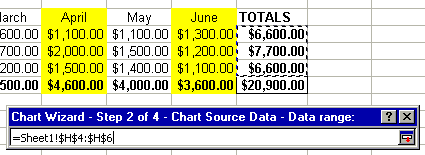
To continue, click on the Return box ( ).
You should see that the range has been sent to the chart wizard, as illustrated
below. Click "next." ).
You should see that the range has been sent to the chart wizard, as illustrated
below. Click "next." 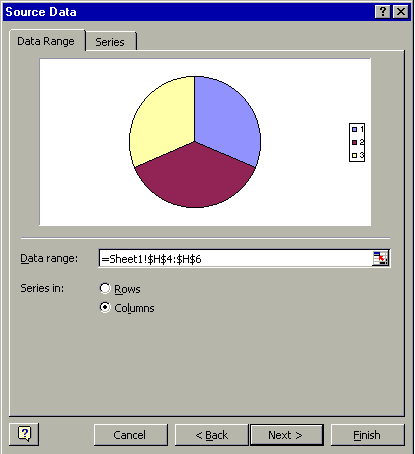
Step three in the Chart Wizard is where you can set the title of the chart
and well as formatting the legends and data labels. You see a real time
preview of what your chart will look like in the preview box. When you
have formatted the chart to your tastes, click the "next" button. 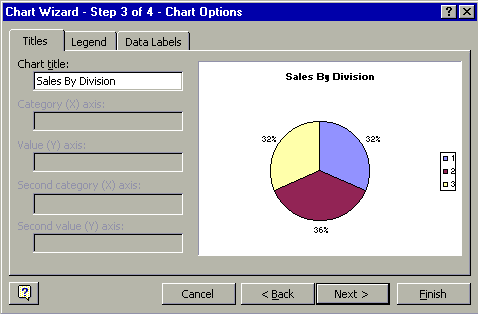
The last step is simply to decide where you want your new chart. If you
are going to be embedding it into the current worksheet, then select "As
object in:". If you would like the chart to be its own worksheet
within a workbook, then select "As new sheet:" Click
"finish" and you're done! 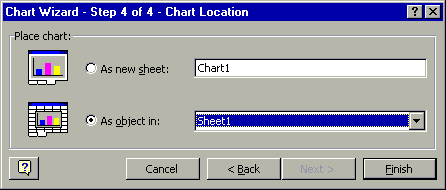
How do I resize my graph (picture, etc.)?
 |
Any image imported into any of the Office 97 titles can be resized in
the exact same manner. First, click on the object. You will
see 8 small black boxes appear around the image. These boxes can
then be dragged to resize the object. If you want the object the
stay in proportion, hold down the "shift" key when you resize.
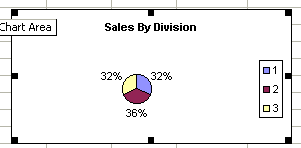
NOTE: With Excel charts, it is important to make sure that
you are selecting the entire object when you click on it because
Excel also allows you to re-size and move individual elements within the
chart. You can test this by holding your mouse still over one of
the resize boxes. If a tip box opens with the words "Chart
Area" (as shown at left) then you have selected the entire chart. |
How do I format my worksheet to print
on a single page?
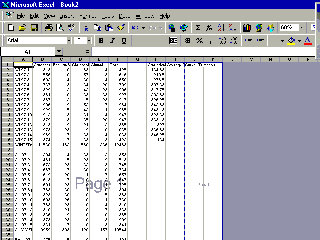
Use the menu View-Page Break Preview. You will see
the sheet displayed as shown to the right. The blue lines
represent page breaks and can be moved simply by dragging them to
encompass the needed information. |
 |
How can I make my sheet print with the gridlines
showing?
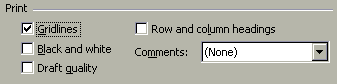 |
By default, Excel does not print the gridlines of a worksheet.
To print the lines, you must change this setting by using the menu File-Page
Setup. A dialogue box will open. Click on the tab
labeled "Sheet" and check the box labeled
"Gridlines" as shown at left. |
|